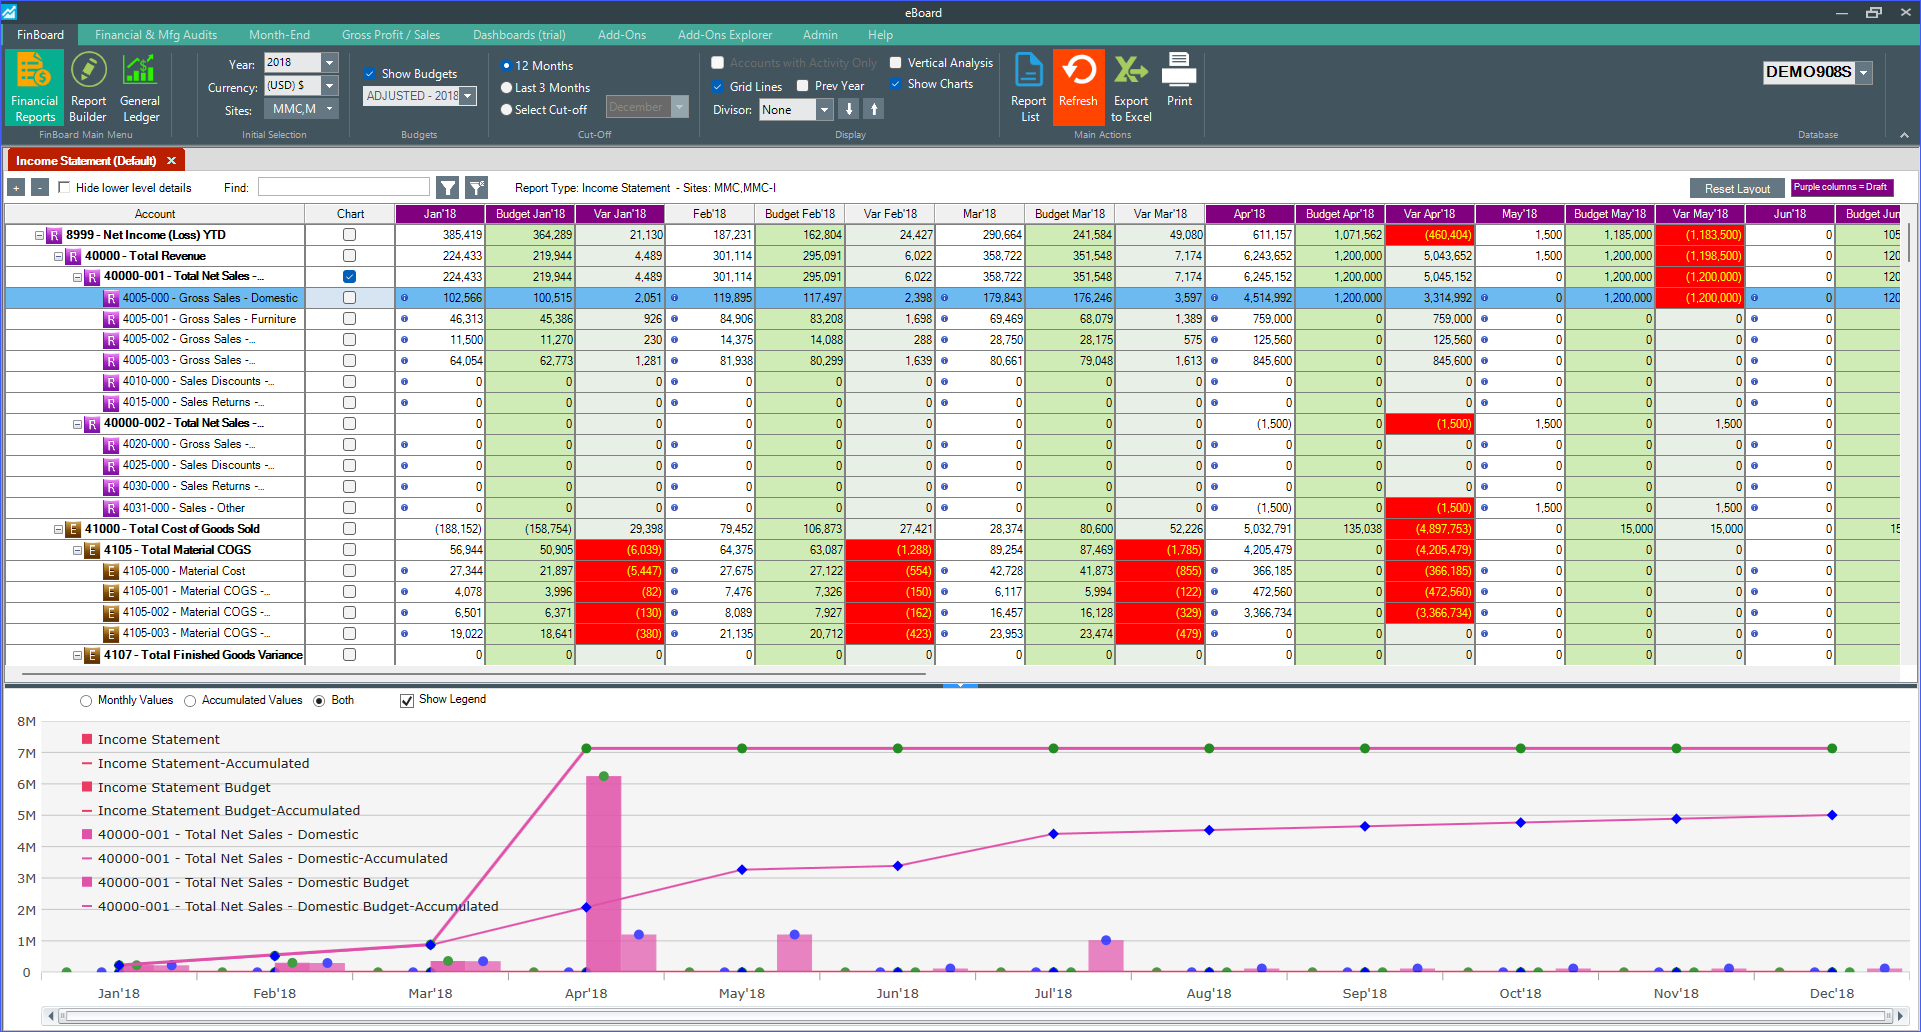
Financial Reports Viewer
This is the functionality that allows you to review one or multiple Financial Statements real time.
-
Main Selections
The first step is to make some selections within the header section, which the app will use to generate the chosen report, as follows:
-
Database: On the right hand side of the screen, select the database you want to generate financial statements for. If you do not see the applicable database, review the App’s settings to ensure the connection has been setup properly.
-
Year: The first field in the header is the year. Here you can select any date from a dropdown menu. When you click the refresh button [i] , all fields in the main grid will update to show the month, budget and variation for each month that year in the main grid. In the next column over, you can change the cut off month to reflect the period in that year which you want to include in your report.
-
Currency: This feature allows you to shift between currencies if you have multiple data bases that require you to change the currency which will be reflected in your final report.
-
Entity: Should your report need to reflect information gathered from a certain entity within your business, you can choose from a dropdown menu the ones which will be included in the financial report. This again is useful if you have multiple databases, in which only certain entities will be included.
-
Show Budgets: If you have budgets setup in your Visual Manufacturing Database, you can include those figures in your financial reports. Select the Show Budgets feature and the applicable Budget from the drop-down list.
-
Display Mode: The App can display the selected financial statements based on a 12 Month mode (you will see the 12 periods on the screen), Last 3 Months (you also need to select the applicable cut-off date for this) or Cut-off date.
-
Accounts with Activity only: Select this feature if you want to remove from the viewer all the accounts that did not have activity for the reporting period.
-
Grid Lines: You can show Grid lines by selecting this feature
-
Previous Year: You can add previous year’s figures to the financial report by enabling this feature
-
Consolidation: This add-on functionality allows you to consolidate Financial Statements from different Visual databases. Refer to the Consolidator Module instructions for more information.
-
Vertical Analysis: This add-on feature allows you to perform proportional analysis of a financial statement, where each line item on a financial statement is listed as a percentage of another item. The Base account or group for Vertical analysis is set up on the Report Builder area – Refer to Report Builder instructions for more information.
2. Action buttons
The second step is to select the Report you want to display on the screen and load it.
There are basically four action buttons within the header section, which are:
-
Report List: Clicking on the report list button allows you to choose what kind of report you would like to display on the Report viewer main screen. When the reports button is clicked, both the included reports and any reports that you have created will show up on the list. The three reports that come with the tool are: Balance Sheet, Income Statement and Trial Balance.
-
Refresh: The refresh button will refresh the program to allow for any changes you may have made on the home screen. For example, if you wanted to change the year of the reports you wanted to show up, you would change the year up in the header and then click the refresh button to allow the program to refresh the information.
-
Print: The print button allows you to print your report to any connected printer.
-
Excel: Clicking the Excel button will open the report in an Excel document. You will want to change the file location and enter a specific name for the excel file; or you can just leave the default name and location as is.
3. Drill-down Feature
To get to the transaction details from the financial reports, double click on the GL Account Balance for each period or YTD figures. Only Posting Level accounts have drill down capabilities (indicated with a blue button).
There are 2 levels of drill down:
-
Summary level: Lists all transactions posted to the account for the period.
-
Detail Level: gives you access to the document/transaction details.