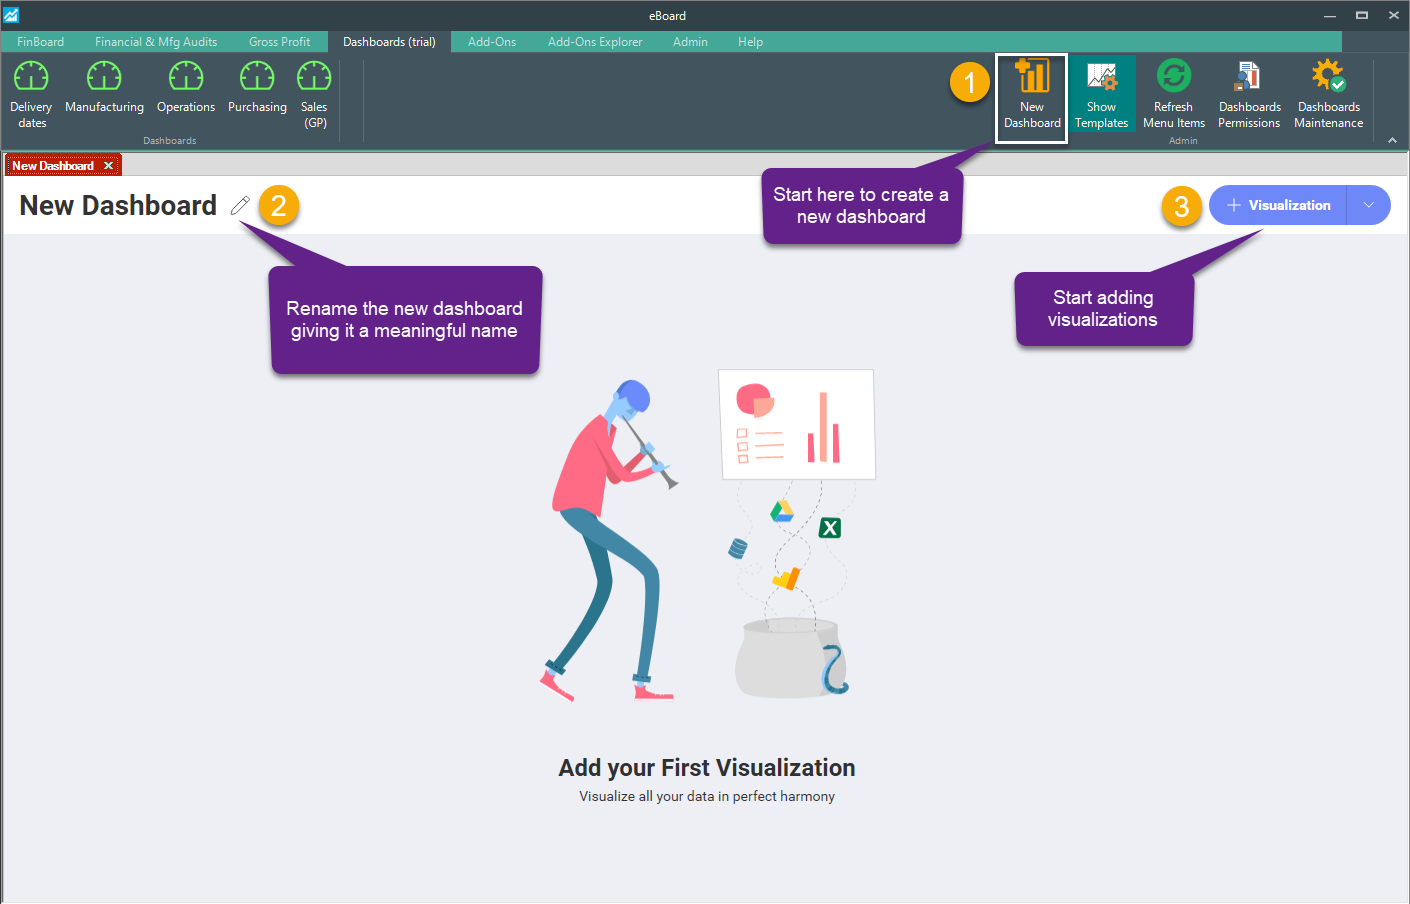
Creating new Dashboards
Follow the instructions provided in the following screens to create and configure a new dashboard.
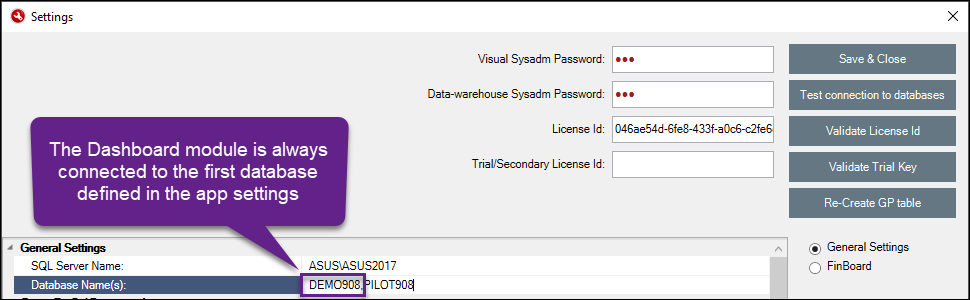
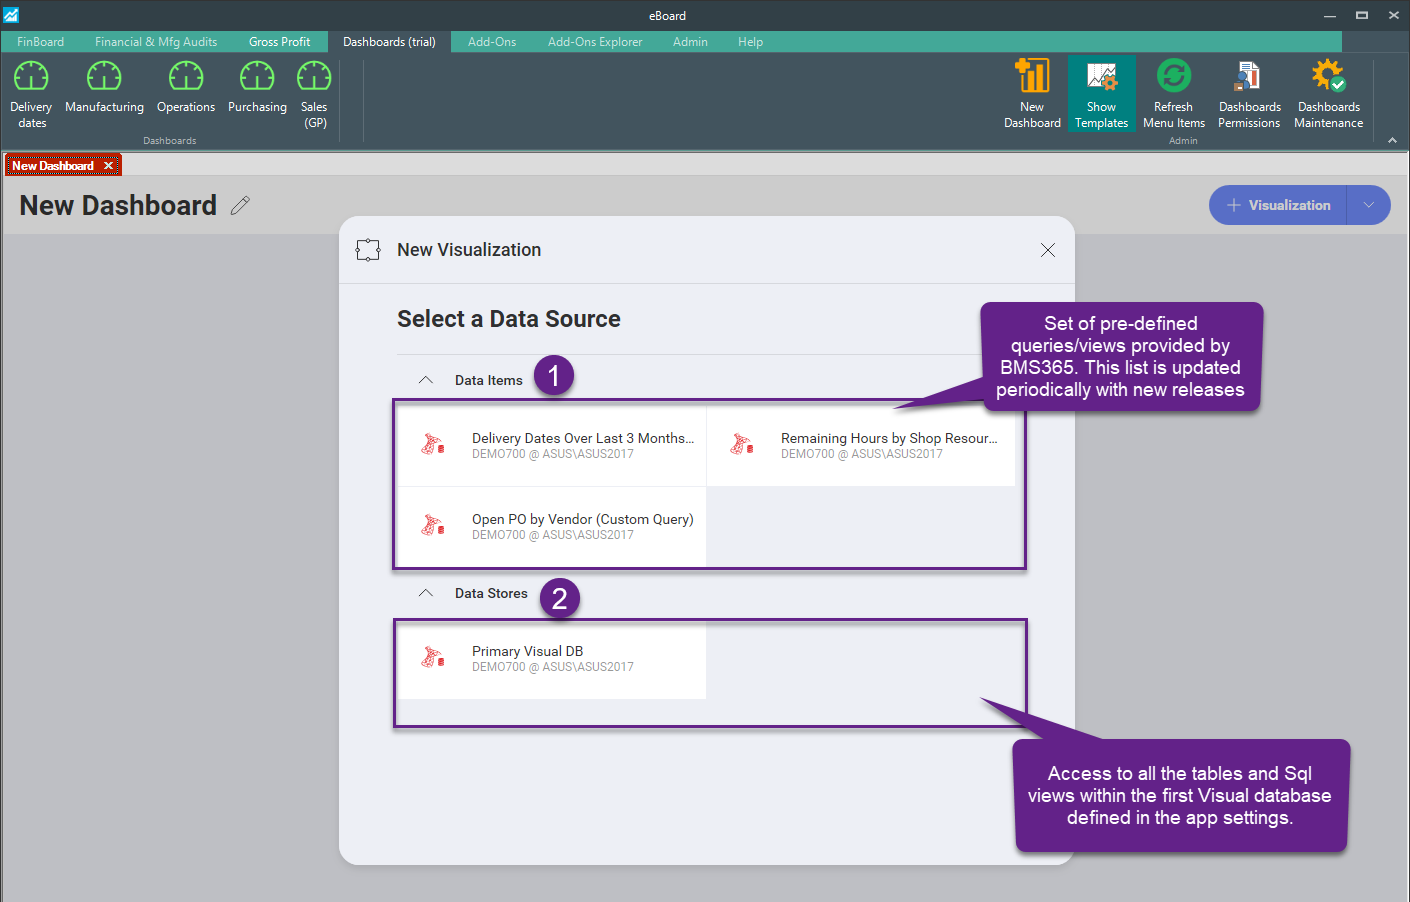
Note: the "Primary Visual DB" shown in the snapshot below under Data-Stores is always the first database defined within the app settings.
The first step is to define the data-source. Data Sources are the places where your data comes from.
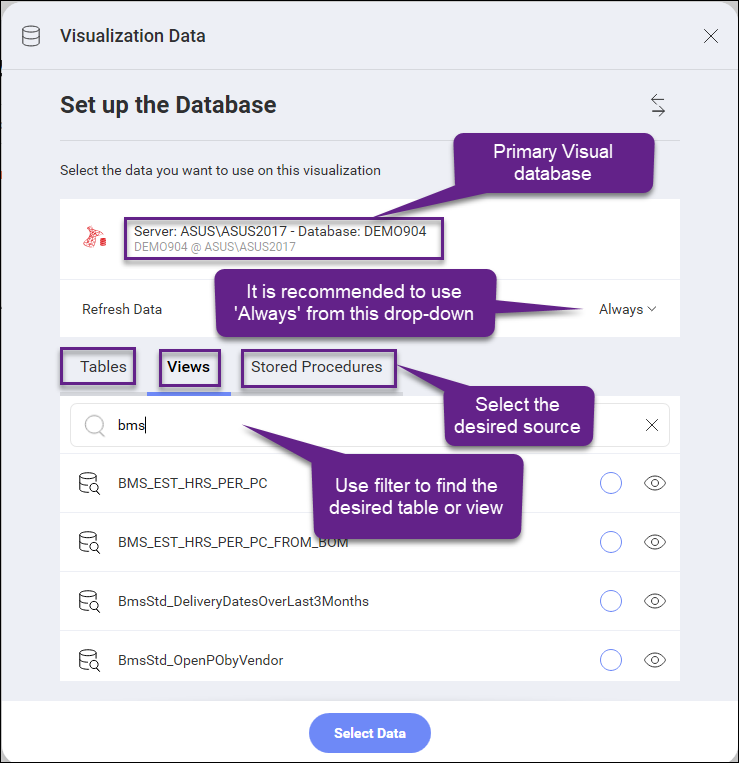
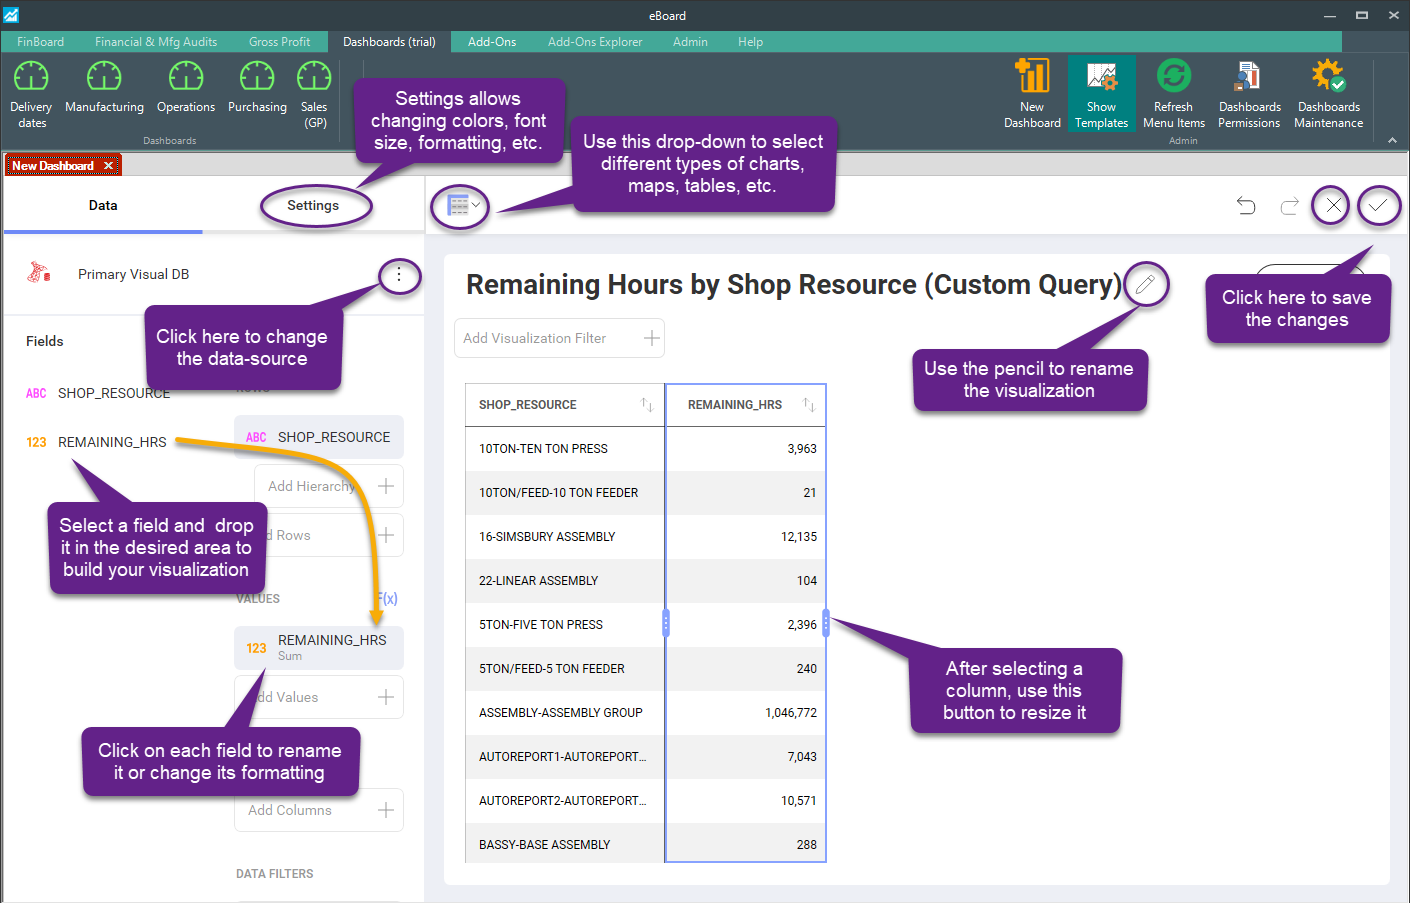
Visualizations Editor
Once a dataset is selected, you will be able to enter the visualizations editor by selecting Edit from the visualization’s overflow button. This view helps you work with the data to get the most desired view; you can also select the most suitable type visualization or chart for it.
Note: After visualizations are created, it is still possible to change their linked data sources. In order to do this, you will first need to select your visualization and enter Edit Mode by selecting Edit from the overflow menu.
Copying and Pasting a Visualization
You can copy & paste any visualization within a dashboard or even across dashboards. Note that you can create new dashboards by mashing up visualizations from other dashboards.