ProjectedQty
This Add-On is somewhat similar to the Material Planning window in Visual, however there are some key differences:
-
Can run for a large set of parts (or all the parts) at once instead of going part by part.
-
Allows flexible Horizon and Time-Buckets definitions.
-
The actual set of parts selected to be studied is determined by a few simple filters.
-
Specific business rules, filters, exceptions, etc. can be embedded within the algorithm that calculates the end quantity (Projected Qty) at the end of each Time Bucket.
-
The contents of the 3 main grids (Projected Qty, Demand and Supply) can be exported to Excel.
-
Parts with shortages within the selected time horizon can be easily identified by checking a box.
-
Running the Visual MRP is Not Required. This tool has its own engine for calculating the projected inventory levels.
Procedure:
-
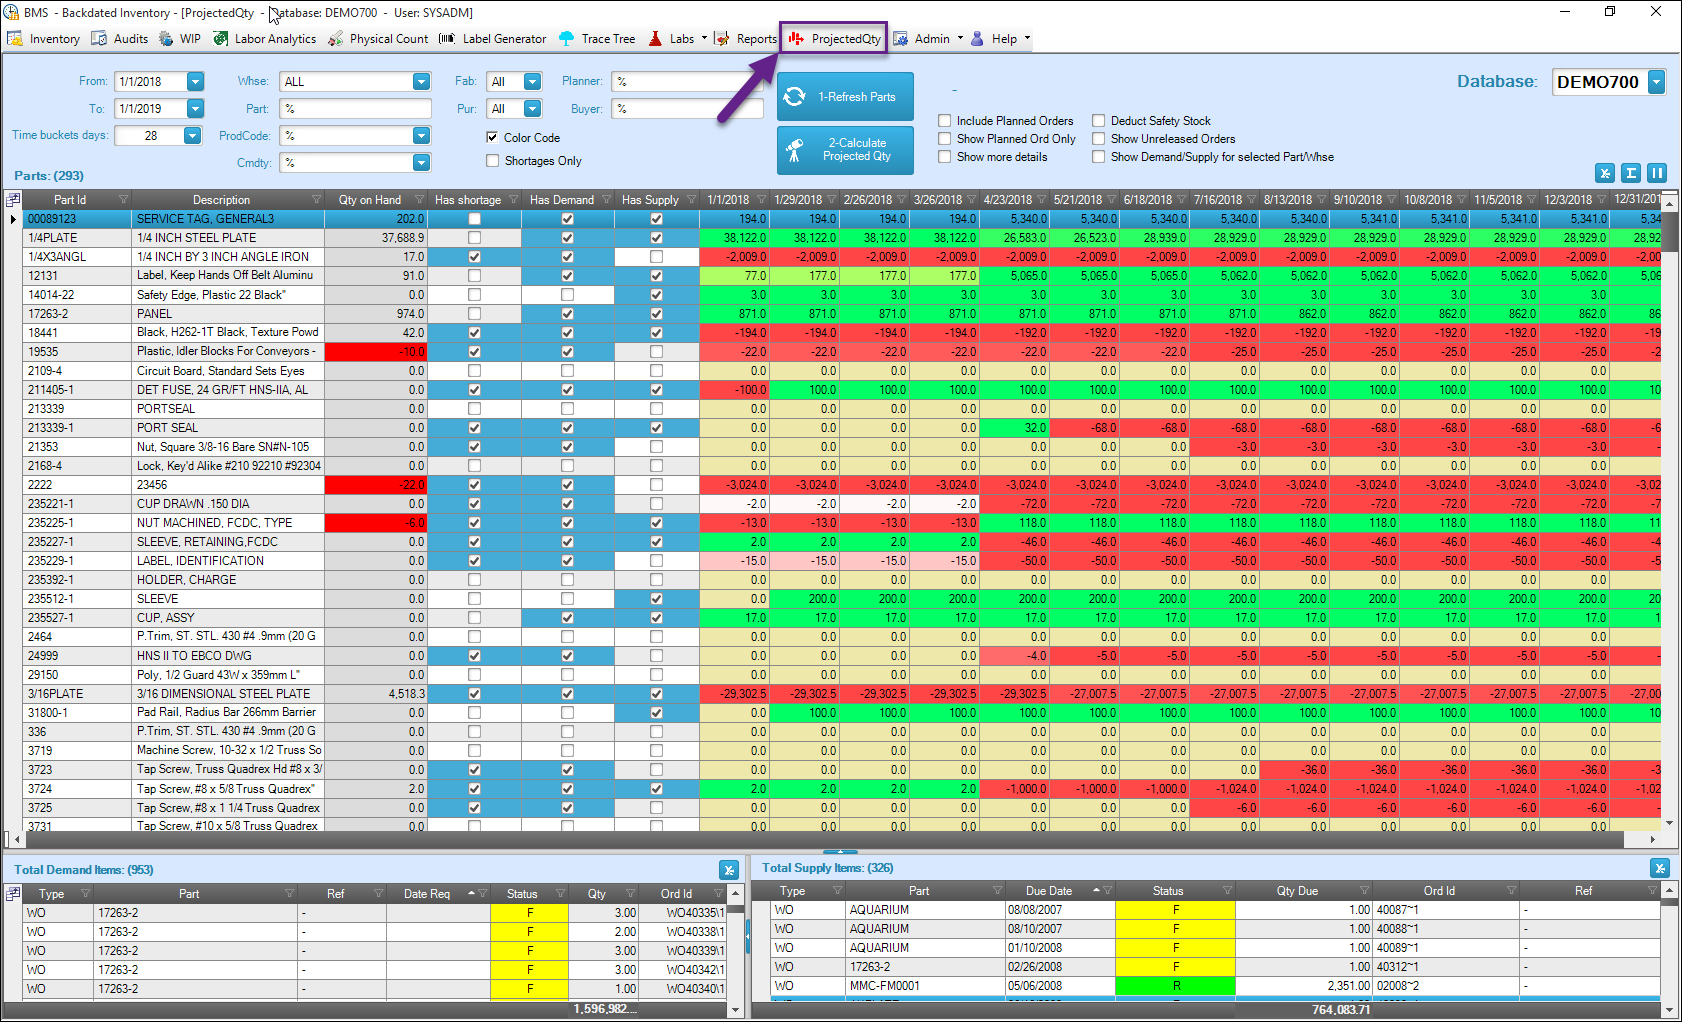
Define the Horizon (From/To dates) and Time Buckets duration (Days).
-
Define any necessary filters (Warehouse, Part, Product Code, Buyer, etc.) to limit the data set to be studied.
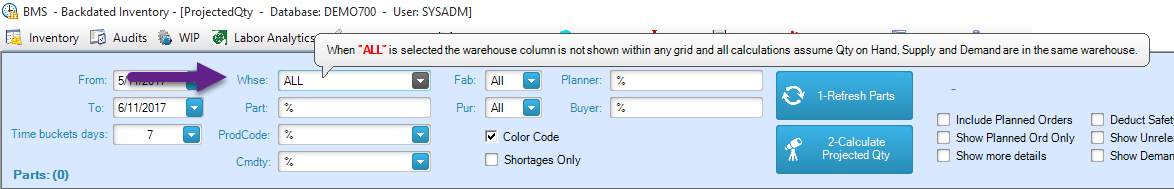
-
Select warehouse = “ALL” if you want this tool to run all calculations assuming that the current inventory (Qty On Hand), demand and supply are in the same warehouse. In this case the warehouse column will not be shown on any grid.
-
Press the “1-Refresh Parts” button. The app will load the set of parts according to the filtering criteria and add new columns to the main grid to cover the horizon defined in step 1. Depending on the size of the database, you may want to limit the number of parts by applying different filters and analyze them in smaller groups.
-
Press the “2-Calculate Projected Qty”. In this step the app will go over the list of parts loaded in step 1 and calculate the Projected Qty by end of each time bucket (columns within the main grid) using the following expression:
Projected Qty = Current Qty on Hand – Demand + Supply
-
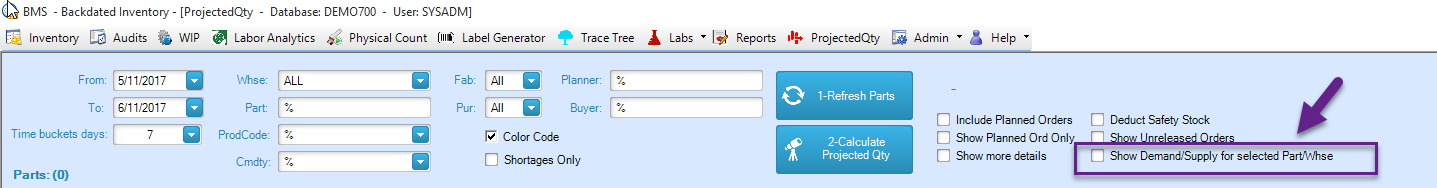
To facilitate the analysis you may want to check the “Show Demand/Supply for selected Part/Warehouse” box. In this case, the data shown in the 2 lower grids will be filtered based on the Part and Warehouse of the row selected in the top grid.
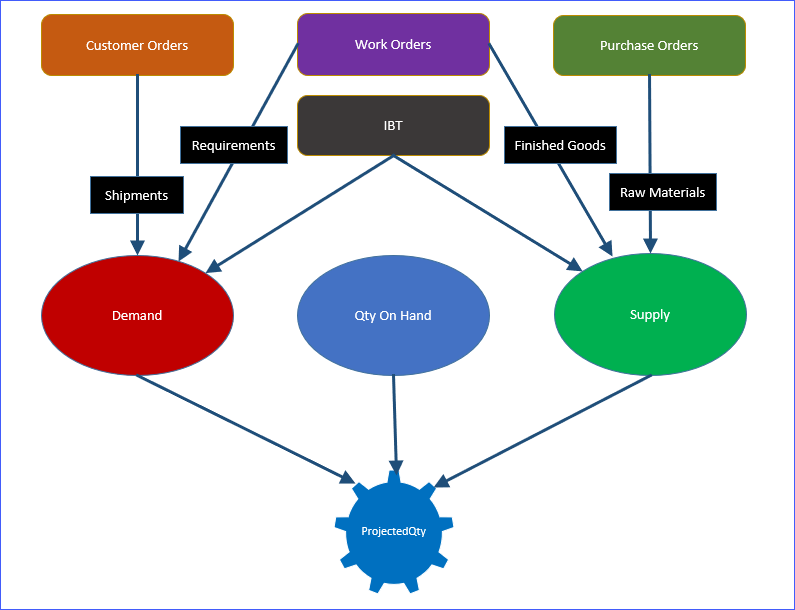
Sources of Demand and Supply