Labor Analytics
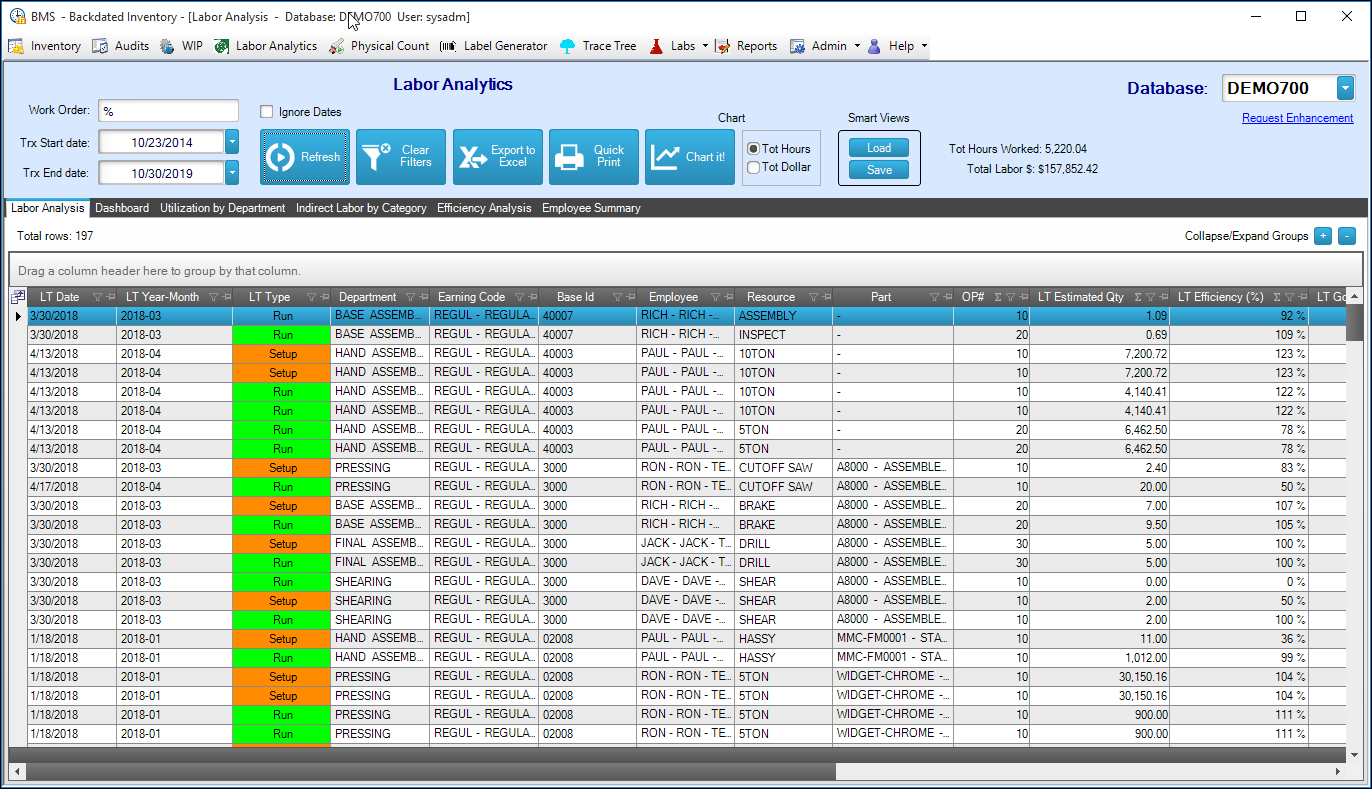
This module allows you to perfom Labour Ticket analysis.
Main Steps:
-
Select the database you want to work on (top right corner)
-
Enter a transaction Start date
-
Enter a transaction End date
-
Click Refresh.
-
All the labour tickets entered in Visual for that timeframe will be displayed in the main grid
-
You can filter by any column, or sort the information by clicking on the column title
-
Your can group the information by dragging and dropping any column title at the top of the grid. You can have various levels of grouping.
-
Once you have filtered and/or groupped the information, you can use the Smart Views feature to Save the view: Click on Smart Views Save - you have the option to save the filters if required.
How to load a Smart View
1. The next time you need to apply a saved view, repeat steps from 1 to 3 described above.2. Once the information is on the main grid, click on Smart Views Load button.3. Select the Smart view you want to load and click ok.Other features:
1. Group by: drag and drop any column title/s onto the top of the grid
2. Export to Excel: this button allows you to take all the information displayed on the main grid to MS Excel - if you built a Group-by view, the app will also display it in MS Excel.
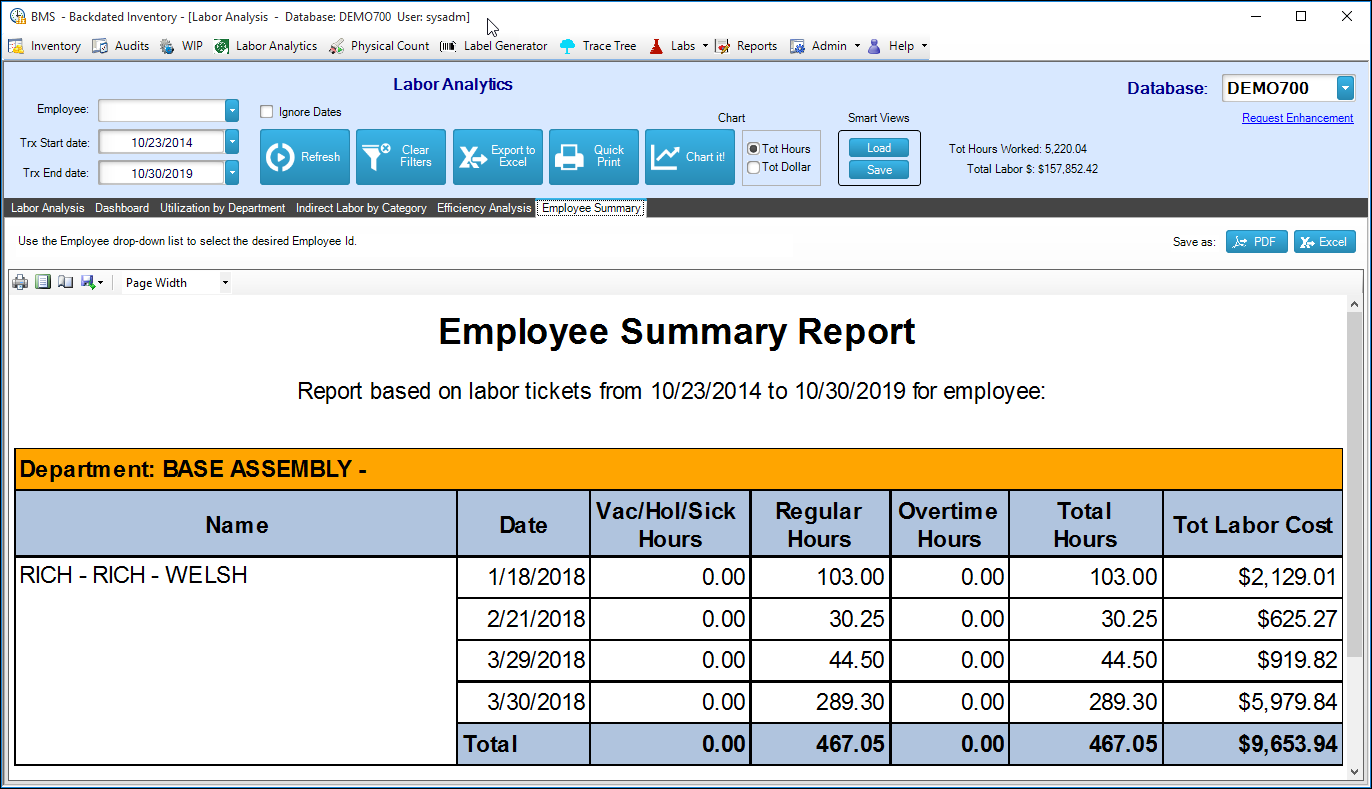
3. Work order labour ticket audit: if you want to review the labour ticket activity for a specific job, enter the job number on the Work Order field. You can ignore the dates if you do not know the specific time frame in which that job had activity.
4. Quick Print: this feature allows you to send the information from the main grid to the printer.
5. Chart it!: Once you use the group-by feature, the app allows you to create a chart with that information - you have the option to display the data in Hours or in Dollars.